GSMArena feature lab: Enter new goodies
Enter new goodies
Audio quality test
Until recently, sound quality used to be a subjective matter in our reviews. Realizing that mobile phones are more than ever used as portable music players, subjective just won't do any more. That is why we at GSMArena will be including a new audio tests in our reviewing routine - the audio quality test.
To give you a more objective view of how the music players perform in all those handsets we review, we decided to record audio samples of each device, analyze the results and publish those for your geeky pleasure.
It must be pointed out that we are not testing the retail headsets that come with the various handsets - our audio quality test concerns only the quality of the music player output. A mediocre set of headphones will obviously make things worse than they are in our tests.
In order to record the samples needed for analysis we use the M-Audio Fast Track Pro external audio interface, which has decent enough capabilities to allow testing even the most high-quality portable music players. You can find its quick Line Input specs here.
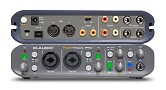
M-Audio Fast Track Pro external audio interface
Having the right hardware, however, is not enough to do the job. We chose the RightMark Audio Analyzer (RMAA) software to do all the analyzing. First off, we use a calibration sound (generated by RMAA) in order to set the input levels right each time. Then we play a special test tone (again, generated by RMAA) which allows the software to evaluate the signal captured real time with the M-Audio Fast Track Pro.
All this gives us the opportunity to create a controlled environment, which should produce accurate and comparable results throughout all the units tested. With all the handsets, we test how they perform both at the maximum volume level, as well as several notches down. This is mainly due to the reason that some music players can produce a lot of distortion at the highest volume levels, while they would play perfectly fine at a moderate volume level. It's also worth saying that during the tests we disable all available equalizer settings and sound enhancements, that the handset music players may be equipped with.
The RMAA software produces results on several important aspects of sound quality. Usually, the high-quality sound reproduction should demonstrate minimal or unnoticeable levels of noise and distortion, and an accurate frequency response.
The frequency response curves seen on our RMAA generated graphs are often used to indicate the accuracy of amplifiers and speakers in reproducing audio. Good frequency response does not guarantee a specific fidelity, but only indicates that a piece of equipment meets the basic frequency response requirements. As an example, a high fidelity amplifier may be said to have a frequency response of 20 Hz - 20,000 Hz ±1 dB. This means that the system amplifies all bands from 20 Hz to 20,000 Hz with a maximum positive or negative deviation from the straight line of only 1 dB. Larger deviations below 40 Hz or above 15 kHz are OK, since the human ear is unable to perceive those sounds. Here lower absolute numbers mean the handset treats all sounds equally; it won't impose its will on the music but will allow you to hear the music as it was recorded, which is what a good piece of audio equipment should do.
The noise levels are the next important aspect of sound reproduction. As seen in our tests, noise is usually measured in relation to the signal levels, otherwise known as the signal-to-noise ratio. In less technical terms the signal-to-noise ratio compares the level of a desired signal (such as music) to the level of background noise ('background' meaning unwanted interferences created by the equipment). So the higher the signal-to-noise ratio, the less obtrusive the background noise, hence the reproducing equipment is of a higher quality.
The dynamic range is another important factor. The human sense of hearing has a very high dynamic range. A person is capable of hearing anything from a quiet murmur in a soundproofed room to the sound of the loudest rock concert. A difference like this can be up to 100dB. A person however cannot perform these feats of perception at both extremes of the scale simultaneously - you cannot hear a whisper in a noisy street for example. Nevertheless, a good quality audio reproduction system should be able to reproduce accurately both the quiet sounds and the loud at the same time. Audio engineers often use the term dynamic range to describe the ratio of the loudest possible undistorted sound to the quietest or to the noise level, say of a microphone or loudspeaker. This dynamic range of an audio device is also sometimes referred to as the dynamic window. To mathematically determine a dynamic range you must take the difference between the ceiling and the noise floor of an audio device. For example, if the ceiling of a device is 10 dB and the floor is 3 dB then the dynamic range is 7 dB, since
The total harmonic distortion (THD) and the intermodulation distortion (IMD) might be the next items you will notice on our measurement results. By the name you know they are a measure of the unwanted altering of the original signals. Distortion is the name given to anything that alters a pure input signal in any way other than changing its magnitude. So, as you might have guessed it, the lower the number, the better the sound reproduction.
The stereo crosstalk is another thing of importance that we measure in our tests. Crosstalk measurement is made to determine the amount of signal leaking across from one channel to another or in purely non-technical terms it measures how good the stereo is. So, the higher the absolute value, the better the stereo.
We are unable to post results retroactively for the mobile handsets that have already been reviewed at GSMarena.com but we will do our best to collect sound analysis data for all the handsets we can get our hands on from now on.
In the meantime, you can have a look at the data collected from handsets that were available at the time we made the tests. It is presented in a tabular form but you will find that there are links to frequency response and noise graphs. You might like to browse and compare them too.
Update 20 Sep 2010: Recently we decided to add some additional testing in our usual audio quality testing routine. The numbers we've published so far reflect the phone performance when plugged into an active amplifier (i.e. your car stereo or your home audio system). Since recently, we started testing each phone two times. The second try is with headphones attached. As it turns out in many cases the added resistance of the headphones makes the audio output quality worse.
We use a pair of AKG headphones with impedance of 32 ohms for each of those special second runs.
| Test | Frequency response | Noise level | Dynamic range | THD | IMD + Noise | Stereo crosstalk |
| Apple iPod 5G | +0.41, -1.16 | -91.6 | 91.8 | 0.0043 | 0.015 | -83.6 |
| +0.34, -1.16 | -90.8 | 91.3 | 0.0050 | 0.016 | -91.4 | |
| +0.52, -1.05 | -89.9 | 90.1 | 0.0033 | 0.016 | -93.1 | |
| Asus P750 | +0.55, -3.34 | -86.3 | 86.2 | 0.0081 | 0.926 | -76.2 |
| HTC Touch Diamond | +0.42, -2.46 | -84.0 | 87.0 | 0.023 | 0.338 | -85.6 |
| +0.35, -1.12 | -85.3 | 87.9 | 0.027 | 0.267 | -86.3 | |
| LG Chocolate | +0.40, -1.14 | -81.8 | 81.6 | 0.048 | 0.062 | -78.6 |
| LG KF600 | +0.45, -1.23 | -78.4 | 76.4 | 0.016 | 0.072 | -58.0 |
| LG KF700 | +0.27, -1.42 | -84.5 | 84.9 | 0.019 | 0.047 | -38.7 |
| LG KF750 Secret | +0.53, -1.02 | -87.1 | 87.3 | 0.0099 | 0.023 | -85.8 |
| LG KS20 | +0.80, -3.60 | -85.6 | 88.7 | 0.063 | 1.310 | -86.7 |
| LG KT610 | +0.49, -1.63 | -86.0 | 85.8 | 0.0066 | 0.028 | -85.8 |
| LG KU990 Viewty | +0.29, -2.07 | -86.8 | 83.8 | 0.020 | 0.0124 | -86.6 |
| Nokia 3120 classic | +0.65, -0.86 | -76.6 | 79.0 | 0.018 | 0.439 | -73.9 |
| +1.12, -0.89 | -69.4 | 72.5 | 0.017 | 0.115 | -68.4 | |
| Nokia 3600 slide | +0.59, -0.95 | -70.7 | 71.1 | 0.0087 | 0.065 | -71.1 |
| Nokia 5220 | +0.29, -1.64 | -91.7 | 90.3 | 0.012 | 0.612 | -73.1 |
| Nokia 5310 | +0.29, -1.69 | -94.4 | 92.0 | 0.015 | 0.491 | -73.8 |
| +0.48, -1.50 | -66.5 | 66.4 | 0.017 | 0.161 | -67.0 | |
| Nokia 6220 classic | +0.68, -0.83 | -75.4 | 75.1 | 0.0081 | 0.051 | -74.0 |
| Nokia 6500 slide | +0.52, -0.98 | -79.7 | 78.0 | 0.0057 | 0.051 | -70.9 |
| Nokia 6600 fold | +0.34, -2.12 | -82.6 | 83.3 | 0.011 | 1.991 | -81.2 |
| Nokia 6600 slide | +0.35, -1.99 | -82.7 | 83.5 | 0.010 | 1.883 | -81.9 |
| Nokia 7500 | +1.11, -1.46 | <-72.6 | 72.1 | 0.017 | 0.094 | -71.6 |
| Nokia E51 | +0.78, -1.36 | -76.4 | 76.2 | 0.015 | 0.096 | -74.8 |
| Nokia E66 | +0.74, -0.84 | -72.3 | 72.5 | 0.021 | 0.102 | -72.9 |
| Nokia E71 | +0.74, -1.26 | -74.5 | 74.7 | 0.016 | 0.097 | -75.8 |
| Nokia N78 | +0.30, -1.59 | -76.1 | 76.1 | 0.014 | 0.548 | -72.7 |
| Nokia N81 | +0.39, -1.13 | -86.6 | 85.8 | 0.041 | 0.040 | -69.9 |
| Nokia N82 | +1.10, -1.53 | -81.6 | 80.8 | 0.0046 | 0.137 | -69.3 |
| Nokia N85 | +0.28, -1.19 | -94.4 | 95.4 | 0.305 | 0.701 | -88.1 |
| Nokia N95 | +1.17, -2.68 | -74.9 | 74.9 | 0.019 | 0.186 | -75.3 |
| Nokia N95 8GB | +1.14, -1.68 | -77.1 | 76.9 | 0.0066 | 0.148 | -68.5 |
| Nokia N96 | +0.52, -2.14 | -90.6 | 90.7 | 0.016 | 0.364 | -73.5 |
| O2 Cocoon | +0.27, -1.30 | -80.1 | 79.8 | 0.0089 | 0.035 | -79.6 |
| Samsung D780 | +0.46, -1.07 | -86.9 | 87.0 | 0.0033 | 0.150 | -88.3 |
| Samsung D880 Duos | +0.34, -1.17 | -84.4 | 84.5 | 0.0030 | 0.087 | -85.2 |
| Samsung D900 | +0.41, -1.12 | -91.0 | 86.6 | 0.0067 | 0.026 | -89.9 |
| Samsung E250 | +0.28, -1.92 | -89.7 | 89.4 | 0.0027 | 0.043 | -87.9 |
| Samsung F110 Adidas | +0.49, -1.07 | -89.1 | 88.7 | 0.0023 | 0.021 | -88.8 |
| Samsung F490 | +0.46, -1.45 | -81.1 | 81.0 | 0.0092 | 0.175 | -81.7 |
| Samsung F700 | +0.50, -1.13 | -81.6 | 81.2 | 0.0052 | 0.097 | -82.1 |
| Samsung G400 Soul | +0.38, -1.68 | -93.2 | 94.4 | 0.356 | 0.797 | -97.4 |
| Samsung G800 | +0.37, -1.19 | -86.7 | 86.0 | 0.017 | 0.050 | -83.2 |
| Samsung G810 | +0.37, -1.19 | -86.7 | 86.0 | 0.017 | 0.050 | -83.2 |
| Samsung i550 | +0.74, -0.76 | -90.8 | 86.9 | 0.0024 | 0.033 | -89.1 |
| Samsung i900 Omnia | +0.37, -1.15 | -79.3 | 79.3 | 0.0039 | 0.027 | -78.7 |
| +0.54, -1.25 | -86.4 | 85.7 | 0.0048 | 0.0165 | -38.3 | |
| Samsung S7330 | +0.33, -1.63 | -85.4 | 85.7 | 0.018 | 0.048 | -85.7 |
| Samsung U600 | +0.41, -1.12 | -89.2 | 86.5 | 0.0040 | 0.019 | -86.9 |
| Samsung U800 Soul b | +0.56, -1.01 | -86.2 | 82.9 | 0.478 | 0.602 | -83.3 |
| Samsung U900 Soul | +0.29, -1.25 | -84.6 | 84.6 | 0.017 | 0.052 | -82.9 |
| +0.21, -1.04 | -85.7 | 88.8 | 0.014 | 0.030 | -84.8 | |
| Sony Ericsson K850 | +0.21, -1.04 | -85.7 | 88.8 | 0.014 | 0.030 | -84.8 |
| Sony Ericsson W910 | +0.25, -1.25 | -81.5 | 82.7 | 0.0071 | 0.028 | -81.9 |
| +0.31, -1.25 | -86.0 | 89.4 | 0.037 | 0.828 | -86.3 |
If you pay closer attention, you might notice a suspicious resemblance between the results produced by the Samsung handsets and the iPod unit we were testing. We were caught off guard too and we even thought we had some kind of a problem with our test setup. But after we checked on the matter, it turned out that Samsung are in fact supplying Apple with audio processors.
Reader comments
- Samsusguy
- 15 Dec 2023
- KiN
I'm nothing like y'all 😎😭😭 I'm nothing like y'all 😎😭😭 I'm nothing like y'all 😎😭😭 I'm nothing like y'all 😎😭😭
- Anonymous
- 15 Nov 2017
- YQ%
Does the audio quality test results include earpiece speaker as well?