IDC: tablet and Chromebook shipments grew in 2021, but things are slowing down
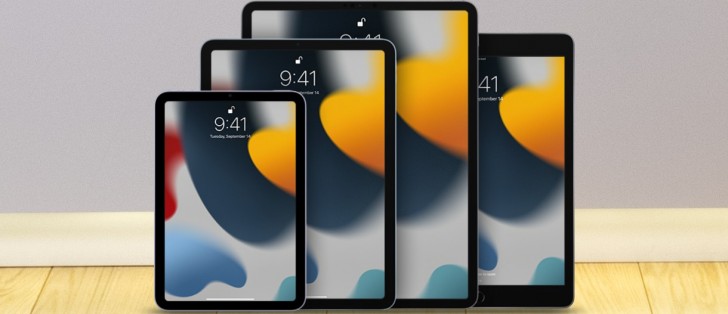
2020 was a banner year for tablets with record shipments in the fourth quarter. This was driven by the surge of people who work or study at home due to the pandemic. Now with the pandemic easing off, shipments are slowing down as well, according to data from the IDC.
2021 was still positive for manufacturers as total shipments went up 3.2% for the full year, reaching a total of 168.8 million. That’s the most slates shipped since 2016. However, the final quarter of the year made it clear that the demand is past its peak.
In Q4 2021 tablet shipments were down to 46 million units, the first decline since the pandemic began. Also, almost all manufacturers in the Top 5 posted negative year-over-year growth (all but Amazon, which is essentially level with a 1.3% rise).
It is Samsung and Lenovo that took the biggest hits, Huawei too, if you consider the Honor tablets that the company used to ship. Apple is still by far the biggest player, check the tables below for a detailed breakdown.
| Top Five Tablet Companies, Worldwide Shipments, Market Share, and Year-Over-Year Growth, Q4 2021 (Preliminary results, combined company view for the current quarter only, shipments in millions) | |||||
| Company | 4Q21 Unit Shipments | 4Q21 Market Share | 4Q20 Unit Shipments | 4Q20 Market Share | Year-Over-Year Growth |
| 1. Apple | 17.5 | 38.00% | 19.1 | 36.60% | -8.60% |
| 2. Samsung | 7.3 | 15.90% | 9.3 | 17.80% | -21.60% |
| 3. Lenovo | 4.6 | 10.00% | 6.2 | 11.80% | -25.40% |
| 4. Amazon.com | 3.6 | 7.90% | 3.6 | 6.80% | 1.30% |
| 5. Huawei* | 2.5 | 5.50% | 2.9 | 5.60% | -13.90% |
| Others | 10.5 | 22.80% | 11.1 | 21.30% | -5.90% |
| Total | 46 | 100.00% | 52.2 | 100.00% | -11.90% |
| 5. Huawei (including Honor volume in 4Q20) |
2.5 | 5.50% | 3.3 | 6.30% | -23.50% |
| Source: IDC Worldwide Quarterly Personal Computing Device Tracker, January 28, 2022 | |||||
| Top Five Tablet Companies, Worldwide Shipments, Market Share, and Growth, Calendar Year 2021 (Preliminary results, combined company view for the current quarter only, shipments in millions) | |||||
| Company | 2021 Unit Shipments | 2021 Market Share | 2020 Shipments | 2020 Market Share | Year-Over-Year Growth |
| 1. Apple | 57.8 | 34.20% | 53.3 | 32.60% | 8.40% |
| 2. Samsung | 30.9 | 18.30% | 29.7 | 18.20% | 3.80% |
| 3. Lenovo | 17.7 | 10.50% | 14.8 | 9.10% | 19.20% |
| 4. Amazon.com | 16.1 | 9.50% | 14 | 8.60% | 15.10% |
| 5. Huawei* | 9.7 | 5.70% | 14.3 | 8.70% | -32.10% |
| Others | 36.7 | 21.70% | 37.4 | 22.80% | -1.80% |
| Total | 168.8 | 100.00% | 163.5 | 100.00% | 3.20% |
| 5. Huawei (including Honor volume in 4Q20) |
9.7 | 5.70% | 16 | 9.80% | -39.50% |
| Source: IDC Worldwide Quarterly Personal Computing Device Tracker, January 28, 2022 | |||||
While tablet shipments started to sag in the final quarter, Chromebook shipments experienced a precipitous fall – they were down 63.6% in Q4. However, success earlier on in the year meant that they were still up 13.5% for the full 2021.
This pushed them up to 37 million units total, up from 32.6 million last year and around 15 million in 2019. Part of the slowdown is attributed to the US and European markets becoming saturated, the good news is that there is still demand in emerging markets. That wasn’t all, though.
Chromebooks were hit with a double whammy last year – market saturation and chip supply shortages. With not enough chips to go around, manufacturers focused their supply on Windows laptops, which have higher margins.
| Top Five Chromebook Companies, Worldwide Shipments, Market Share, and Year-Over-Year Growth, Q4 2021 (Preliminary results, combined company view for the current quarter only, shipments in millions) | |||||
| Company | 4Q21 Shipments | 4Q21 Market Share | 4Q20 Shipments | 4Q20 Market Share | Year-Over Year Growth |
| 1. Acer Group | 1.3 | 26.30% | 2.2 | 16.80% | -43.30% |
| 2. Dell Technologies | 1 | 20.30% | 2.7 | 20.30% | -63.60% |
| 3. Lenovo | 0.8 | 16.10% | 2.9 | 22.10% | -73.50% |
| 4. Samsung | 0.6 | 12.30% | 0.8 | 5.80% | -22.40% |
| 5. HP Inc. | 0.5 | 9.90% | 3.5 | 26.90% | -86.70% |
| Others | 0.7 | 15.20% | 1.1 | 8.10% | -31.80% |
| Total | 4.8 | 100.00% | 13.1 | 100.00% | -63.60% |
| Source: IDC Worldwide Quarterly Personal Computing Device Tracker, January 28, 2022 | |||||
| Top Five Chromebook Companies, Worldwide Shipments, Market Share, and Growth, Calendar Year 2021 (Preliminary results, combined company view for the current quarter only, shipments in millions) | |||||
| Company | 2021 Shipments | 2021 Market Share | 2020 Shipments | 2020 Market Share | Year-Over Year Growth |
| 1. HP Inc. | 10.2 | 27.70% | 9.4 | 28.80% | 9.30% |
| 2. Lenovo | 8.3 | 22.40% | 6.7 | 20.70% | 23.40% |
| 3. Acer Group | 6.4 | 17.30% | 6.1 | 18.70% | 4.60% |
| 4. Dell Technologies | 5.4 | 14.60% | 5.7 | 17.50% | -5.20% |
| 5. Samsung | 3.2 | 8.80% | 1.8 | 5.60% | 77.20% |
| Others | 3.4 | 9.20% | 2.8 | 8.70% | 19.50% |
| Total | 37 | 100.00% | 32.6 | 100.00% | 13.50% |
| Source: IDC Worldwide Quarterly Personal Computing Device Tracker, January 28, 2022 | |||||
Related


Reader comments
- dbjungle
- 02 Feb 2022
- S3%
The default Crostini container is Debian. Arch and Manjaro will have newer software versions. You can easily change it to Arch, but I have Manjaro on some other computers so I'm more familiar with it. Basically you'd make a new Arch cont...
- dbjungle
- 02 Feb 2022
- S3%
It's using chroot if you still have Chrome OS as the parent OS. It's using a custom BIOS if you boot straight into Mint / Fedora.
- Quericus
- 01 Feb 2022
- YeV
It was nice to see a resurgence of tablets in 2020 but the Covid pandemic is still not waning as there will be new mutations and variants. Thus tablet sales will continue to be brisk until the pandemic wanes to an epidemic.


 Xiaomi
 Samsung
 Samsung
 Sony
Sony Nothing